
Quickstart
The fastest path from sign-up to a working cube in Saiku Cloud. Prefer to test-drive first? Skip to the No-signup walkthrough — same UI, same demo data, five screenshots, no card.
Prerequisites
- A PostgreSQL, MySQL / MariaDB, Snowflake, BigQuery or MotherDuck warehouse, with read access for a service user. No warehouse? Upload a file instead — CSV, Parquet, JSON or Excel — and Saiku builds a database from it.
- A web browser. That’s it.
Five steps
-
Sign up. Go to cloud.saiku.bi and create an account. We provision your tenant, a workspace, and an initial API key on your behalf.
-
Connect a warehouse. Open Data Sources in the sidebar, pick your warehouse type, and fill in the named fields — host, port, database, credentials. Saiku assembles the JDBC URL for you. Click Test connection; once it passes, a save panel appears. Label the connection and save it.
-
Draft a cube. You land in the cube author. Pick the table that holds your facts, then describe what you want in one line — “revenue and order count by region and date”. AI proposes a Mondrian cube, and you review the measures, dimensions and joins as editable cards. Prefer to build it yourself? New schema on the Schemas page opens a visual canvas with no AI in the loop.
-
Save the schema. When the proposal looks right, click Preview cube schema to generate the Mondrian XML, then Save as new schema version. The cube lands on the Schemas page, ready to query.
-
Query the cube. Open Analyze and click Open in Saiku on your new cube. You land in Saiku Studio with the cube preloaded — drag dimensions and measures onto rows and columns, save the workbook, share it with teammates.
What’s next
- Wire an agent — see Authentication for the API surface.
- Bring your team in — invite members from Members on Team and above.
- Pick a plan — compare tiers on the What’s included page.
No-signup walkthrough
Two ways to try Saiku without signing anything:
- Live demo: demo.saiku.bi —
admin/admin, no card, no signup, and the data resets nightly so you can’t break anything. It carries the FoodMart cubes plus a few others; everything below uses Sales. - Local Docker:
docker run -p 8080:8080 ghcr.io/spiculedata/saiku:latest— pull the same image the demo runs. Full setup in the self-hosting guide.
Either path takes you to the same UI. Here’s what a first query looks like from cold start.
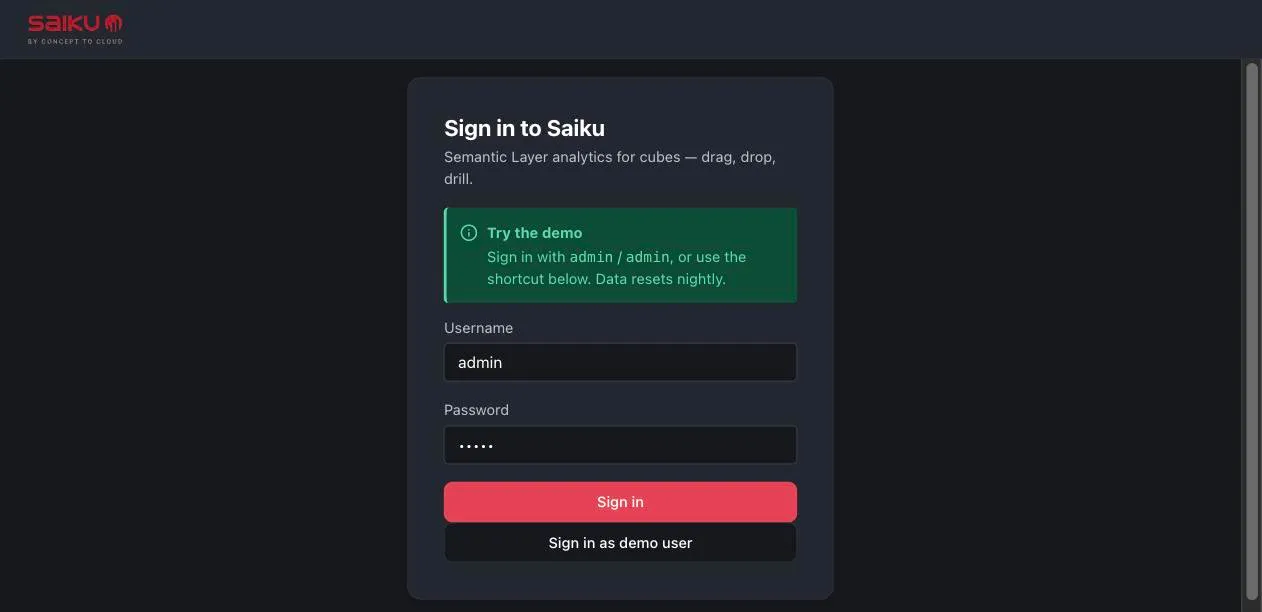
1. Sign in
Both fields come pre-filled on the demo, so you can either click Sign in or take the Sign in as demo user shortcut below it. Demo data resets nightly — poke at anything you like.
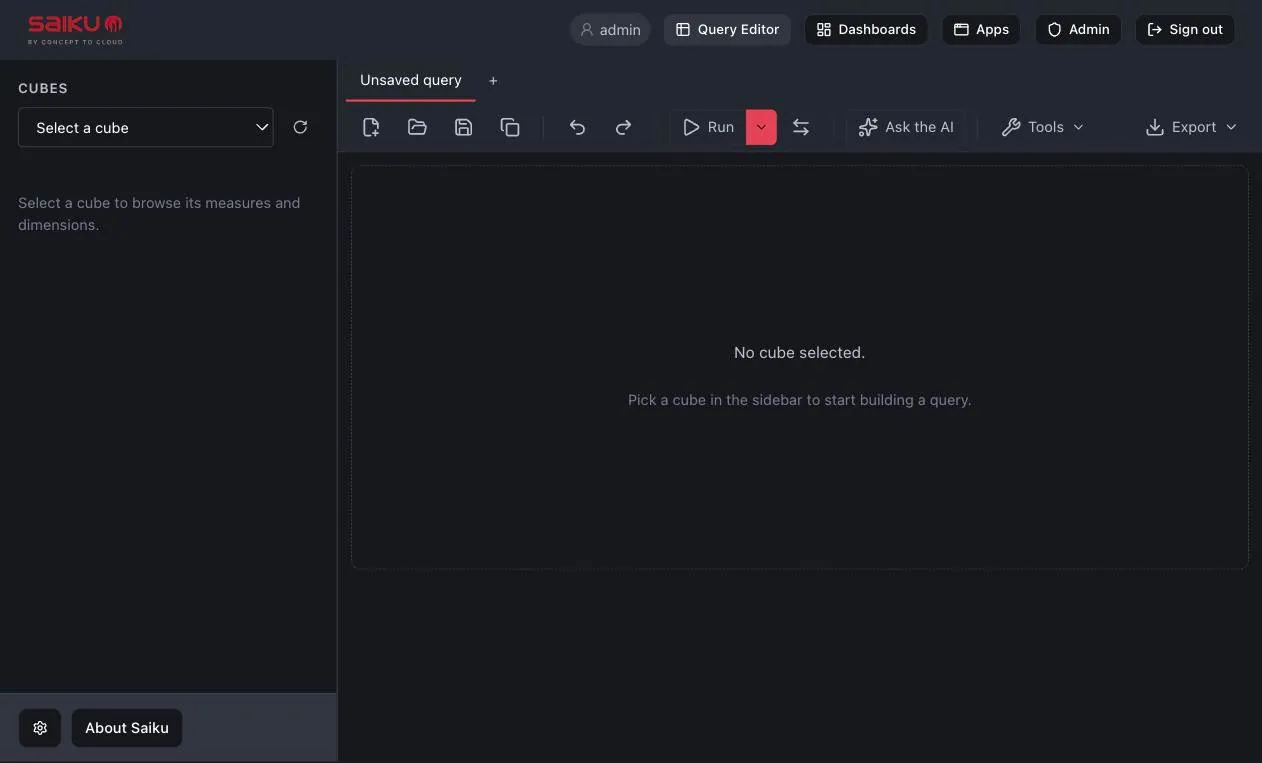
2. Land on the empty workbench
You arrive at the Query Editor: a CUBES picker down the left, an empty query tab across the top, and four drop shelves — MEASURES, COLUMNS, ROWS and FILTER.
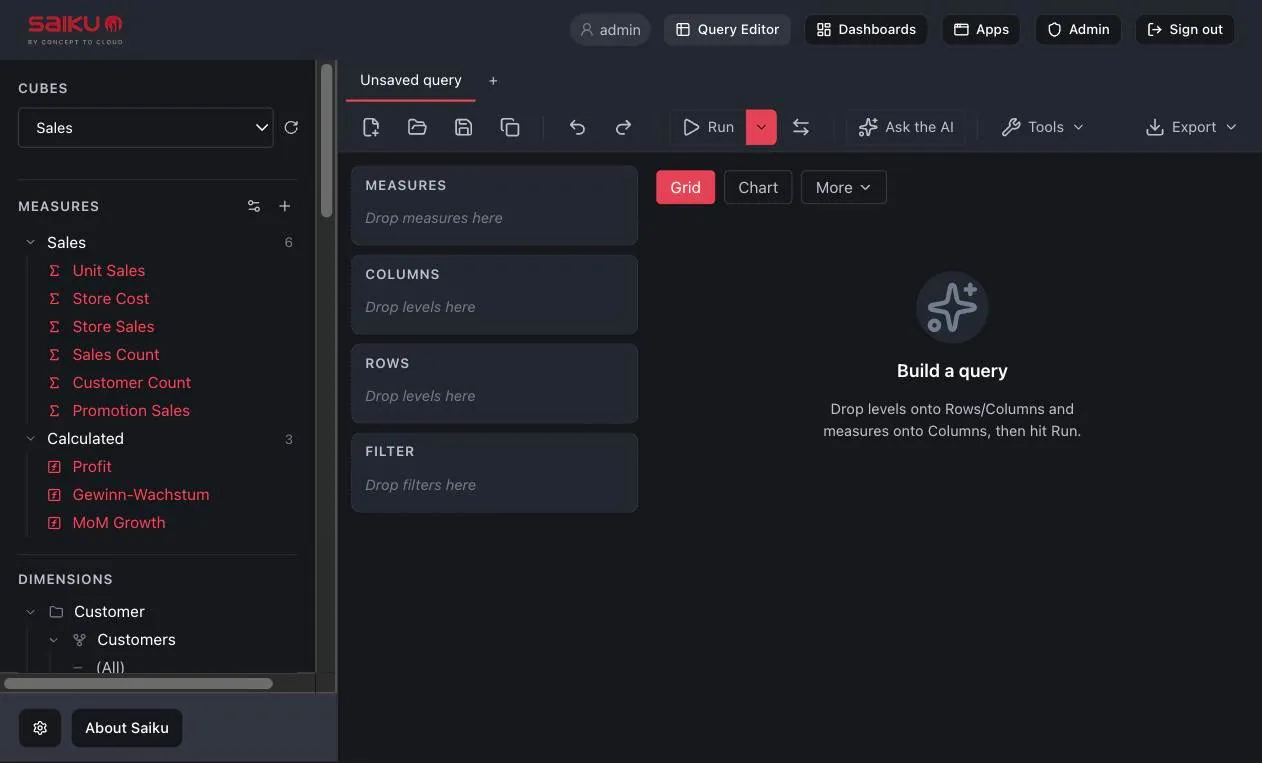
3. Pick a cube
The demo carries the FoodMart schema — the OLAP fixture that’s shipped with Mondrian for decades — plus a few others. Open the picker and choose Sales.
The left panel fills in: six measures (Unit Sales, Store Cost, Store Sales, Sales Count, Customer Count, Promotion Sales), a Calculated group beneath them (Profit, MoM Growth and friends), then the dimensions — Customer, Product, Time, Store, Promotion and more, each expandable down to its levels.
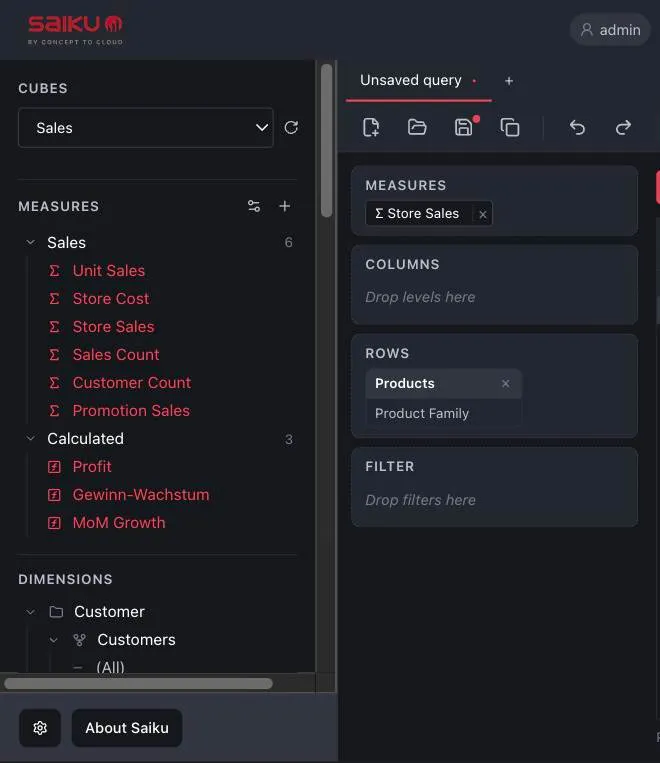
4. Build a query
Two drags:
- Store Sales from the measures list onto the MEASURES shelf.
- Product Family, under the Product dimension, onto the ROWS shelf.
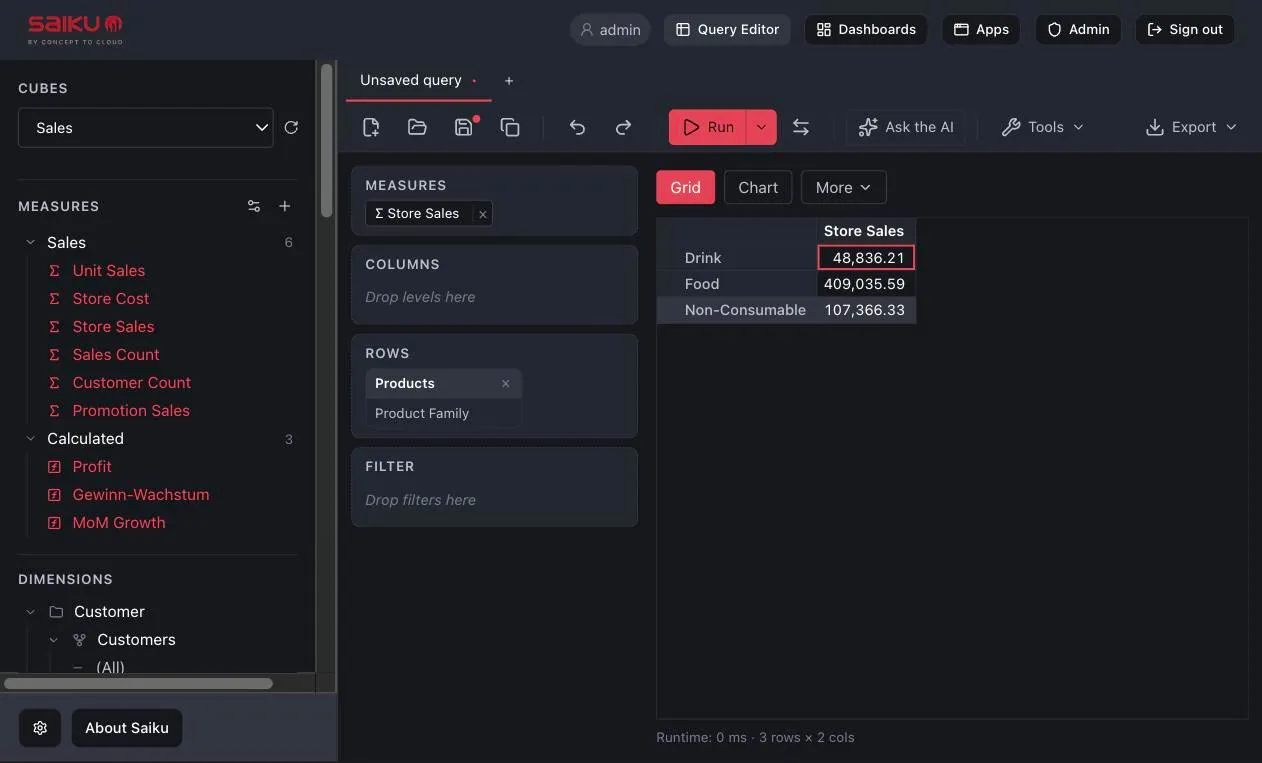
That’s the whole query. There’s no submit step — the grid runs and fills itself in as soon as the shelves make sense together.
5. Read the results
Saiku compiled that to MDX, Mondrian turned it into SQL, and back came three rows: Drink 48,836.21 · Food 409,035.59 · Non-Consumable 107,366.33. The status line under the grid tells you the runtime and the result shape — 3 rows × 2 cols.
Glance at the address bar while you’re here. The whole query is encoded in the URL, so sending someone this exact view is a copy and a paste, with nothing to save first.
6. Swap to a chart
Same query, different view. Click Chart above the grid. You get a bar chart with no configuration — and More holds the compact views (Stats, Sparkline, Sparkbar). Switch chart types, or drop another dimension onto a shelf, and both the grid and the chart re-run together.
What just happened
- The workbench built a typed Mondrian query from the dimensions and measures you dropped on the shelves. No SQL, no MDX in the request body.
- The Mondrian engine translated that to SQL, ran it against the connected warehouse — in the demo, a bundled FoodMart database — and cached the result.
- The grid + chart are two views of the same result — dropping another dimension or swapping measures re-runs the query and refreshes both.
You’ve just done the same thing your analysts and finance team do every day. Every downstream Saiku surface — Excel via XMLA, dashboards, MCP for AI agents, saved workbooks — reads from the same cube definition.
What’s next after the walkthrough
- Connect Excel — the same demo instance publishes an XMLA
endpoint at
https://demo.saiku.bi/xmla. Excel connects the same way as any Analysis Services source; see the Excel guide. - Connect an AI agent via MCP — the MCP server at
/rest/saiku/api/mcpgives Claude Desktop, Cursor, Cline, or any MCP-speaking tool six read-only tools over the same cubes you just queried by hand. See the MCP guide. - Move to your own data — sign up above, connect a real warehouse, and repeat.